Home
|
Contact
Home
Competition
Grand Tours
Gallery
Contact
home
|
grand tours
|
stages
stages details
Giro d´Italia 2024
Vuelta a España 2023
Tour de France 2023
Giro d´Italia 2023
Vuelta a España 2022
Tour de France 2022
Giro d´Italia 2022
Vuelta a España 2021
Tour de France 2021
Giro d´Italia 2021
Vuelta a España 2020
Giro d´Italia 2020
Tour de France 2020
Vuelta a España 2019
Tour de France 2019
Giro d´Italia 2019
Vuelta a España 2018
Tour de France 2018
Giro d´Italia 2018
Vuelta a España 2017
Tour de France 2017
Giro d´Italia 2017
Vuelta a España 2016
Tour de France 2016
Giro d´Italia 2016
Vuelta a España 2015
Tour de France 2015
Giro d´Italia 2015
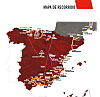
Vuelta a España 2017
72. Vuelta a España
19. Aug. to 10. Sept. 2017
total kilometer
3324
total vertical meters
45916
Δ 45916
Ø stage severity © STS
13.8
Map overview
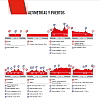
Profile overview
stages
roadbook (111 MB)
The stage severity (STS) is the vertical meters per kilometer of a stage [= vertical meters / kilometer]. The colors from green = flat, to red = steep, indicates the difficulty of the stage.
winner
82:30:02 - 40.3 km/h
- 01:29
t/km
last
+5:16:23 - 37.9 km/h
- 01:35
t/km
The vertical meters for the Giro d´Italia 2024 are the average of the figures published by la-flamme-rouge.eu and sanluca.cc. Stage 20 differs more than 500vm, will be investigated.
№
date
km
vm
Δ
STS
category
P
L
M
IT
RP
GPS
winner
h:mm:ss
last
[m]:ss
km/h
t/km
m:ss
1
Sa.
19.
Aug
13.7
63
63
4.6
TTT-3
0:15:58
+4:43
51.5 39.7
1:10 1:31
2
Su.
20.
Aug
203.4
402
402
2.0
4:36:13
+7:28
44.2 43.0
1:21 1:24
3
Mo.
21.
Aug
158.5
3000
3000
18.9
1-1-2
4:01:22
+38:28
39.4 34.0
1:31 1:46
4
Tu.
22.
Aug
198.2
1740
1740
8.8
3
4:43:57
+10:10
41.9 40.4
1:26 1:29
5
We.
23.
Aug
175.7
2733
2733
15.6
2-3-2-2-3!
4:24:58
+21:47
39.8 36.8
1:30 1:38
6
Th.
24.
Aug
204.4
2600
2600
12.7
3-3-3-3-2
4:47:02
+23:47
42.7 39.5
1:24 1:31
7
Fr.
25.
Aug
207.0
2747
2747
13.3
3-3-3
gpx
4:43:35
+18:08
43.8 41.2
1:22 1:27
8
Sa.
26.
Aug
199.5
2314
2314
11.6
3-3-1!
gpx
4:37:55
+22:37
43.1 39.8
1:24 1:30
9
Su.
27.
Aug
174.0
1785
1785
10.3
2-1!
gpx
4:07:13
+24:04
42.2 38.5
1:25 1:34
Mo.
28.
Aug
Rest day
10
Tu.
29.
Aug
164.8
1350
1350
8.2
3-1
3:34:56
+17:33
46.0 42.5
1:18 1:25
11
We.
30.
Aug
187.5
3490
3490
18.6
1-1!
5:05:09
+34:13
36.9 33.1
1:38 1:49
12
Th.
31.
Aug
160.1
2525
2525
15.8
1-2
3:56:45
+22:04
40.6 37.1
1:29 1:37
13
Fr.
1.
Sept
198.4
1698
1698
8.6
3
4:25:13
+12:44
44.9 42.8
1:20 1:24
14
Sa.
2.
Sept
175.0
3405
3405
19.5
3-2-ESP!
4:42:10
+36:39
37.2 32.9
1:37 1:49
15
Su.
3.
Sept
129.4
3305
3305
25.5
1-1-ESP!
3:34:51
+30:54
36.1 31.6
1:40 1:54
Mo.
4.
Sept
Rest day
16
Tu.
5.
Sept
40.2
350
350
8.7
ITT
0:47:00
+10:30
51.3 41.9
1:10 1:26
17
We.
6.
Sept
180.5
3385
3385
18.8
2-1-ESP!
4:48:52
+24:32
37.5 34.6
1:36 1:44
18
Th.
7.
Sept
169.0
2885
2885
17.1
3-3-2-3!
4:09:39
+25:24
40.6 36.9
1:29 1:38
19
Fr.
8.
Sept
149.7
2060
2060
13.8
1-3-3-3
3:35:46
+24:32
41.6 37.4
1:26 1:36
20
Sa.
9.
Sept
117.5
3500
3500
29.8
1-1-ESP!
3:31:33
+27:24
33.3 29.5
1:48 2:02
21
Su.
10.
Sept
117.6
579
579
4.9
3:06:25
+5:05
37.9 36.8
1:35 1:38
Attention the GPS-files (gpx) are race stages and do not follow the traffic rules. The usage of the GPS-files (gpx) is on your own risk, any liability is excluded. The stages, GPS-files (gpx) were recorded with QMapShack using the information from the official organizer. The stages have been drawn most accurate as possible. Each stage starts at race km 0 and does not include neutralized kilometers. Trackpoints within tunnels were removed to eliminate incorrect vertical meters. We use the digital elevation model (copernicus.eu 1.0 DEM25) and a 5 point median filter to smooth deviation of the track points.
The radtoto.com profiles, GPS-files (gpx) and all data on the page 'stages' were created and published by radtoto.com. Copyright © by radtoto.com, all rights reserved. If you like to modify or publish files or data, ask for our approval.
Copyright © 2004 - 2024 radtoto.com. All rights reserved.
🤡🤡
Aktuell: Heute: Gestern: Gesamt: Seit:


 45916
45916
 Δ 45916