Home
|
Contact
Home
Competition
Grand Tours
Gallery
Contact
home
|
grand tours
|
stages
stages details
Vuelta a España 2023
Tour de France 2023
Giro d´Italia 2023
Vuelta a España 2022
Tour de France 2022
Giro d´Italia 2022
Vuelta a España 2021
Tour de France 2021
Giro d´Italia 2021
Vuelta a España 2020
Giro d´Italia 2020
Tour de France 2020
Vuelta a España 2019
Tour de France 2019
Giro d´Italia 2019
Vuelta a España 2018
Tour de France 2018
Giro d´Italia 2018
Vuelta a España 2017
Tour de France 2017
Giro d´Italia 2017
Vuelta a España 2016
Tour de France 2016
Giro d´Italia 2016
Vuelta a España 2015
Tour de France 2015
Giro d´Italia 2015
La Vuelta (a España) 2023
78. Vuelta a España
Aug. 26th to Sept. 17th 2023
total kilometer
3157.5
total vertical meters
51940
44250 Δ 7690
Ø stage severity © STS
16.4
14.0
Map overview
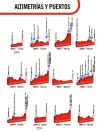
Profile overview
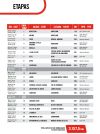
stages
roadbook (20.6 MB)
The stage severity (STS) is the vertical meters per kilometer of a stage [= vertical meters / kilometer]. The colors from green = flat, to red = steep, indicates the difficulty of the stage.
winner
76:48:21 - 41.1 km/h
- 01:28
t/km
last
+4:32:55 - 38.8 km/h
- 01:33
t/km
All stageprofiles with the same scale in length and height
The vertical meters for the La Vuelta (a España) 2023 are the average of the figures published by la-flamme-rouge.eu and sanluca.cc. Stage 14 and Stage 18 has more than 10% deviation. Stage 14: I agree with numbers from sanlucca, Stage 18: I agree with numbers from la-flamme-rouge.
№
date
km
vm
Δ
STS
category
P
L
M
IT
RP
GPS
winner
h:mm:ss
last
[m]:ss
km/h
t/km
m:ss
1
Sa.
26.
Aug
14.8
50
20
30
3.4
1.4
TTT
0:17:30
+3:20
50.7 42.6
1:11 1:24
2
Su.
27.
Aug
181.8
2695
2685
10
14.8
14.8
3-2-3
4:10:06
+8:53
43.6 42.1
1:23 1:25
3
Mo.
28.
Aug
158.5
3460
1885
1575
21.8
11.9
1-1!
4:15:39
+23:41
37.2 34.0
1:37 1:46
4
Tu.
29.
Aug
184.6
1835
2565
-730
9.9
13.9
3-3
4:05:41
+12:10
45.1 43.0
1:20 1:24
5
We.
30.
Aug
186.2
2395
3310
-915
12.9
17.8
2
4:23:43
+15:30
42.4 40.0
1:25 1:30
6
Th.
31.
Aug
183.1
4045
2265
1780
22.1
12.4
3-3-1!
4:27:29
+33:17
41.1 36.5
1:28 1:39
7
Fr.
1.
Sept
200.8
1085
1795
-710
5.4
8.9
4:56:29
+11:00
40.6 39.2
1:29 1:32
8
Sa.
2.
Sept
165.0
3650
2745
905
22.1
16.6
2-3-2-2-1!.
4:13:52
+28:42
39.0 35.0
1:32 1:43
9
Su.
3.
Sept
184.5
2965
1945
1020
16.1
10.5
1-2!
4:28:59
+19:19
41.2 38.4
1:27 1:34
Mo.
4.
Sept
Rest day
10
Tu.
5.
Sept
25.8
100
95
5
3.9
3.7
ITT
0:27:39
+6:15
56.0 45.7
1:04 1:19
11
We.
6.
Sept
163.2
2145
1265
880
13.1
7.8
1!
3:29:17
+17:42
46.8 43.1
1:17 1:23
12
Th.
7.
Sept
150.6
830
1605
-775
5.5
10.7
3:23:35
+9:32
44.4 42.4
1:21 1:25
13
Fr.
8.
Sept
134.7
4345
3785
560
32.3
28.1
3-ESP-1-ESP!
3:51:10
+35:45
35.0 30.3
1:43 1:59
14
Sa.
9.
Sept
156.2
3960
2465
1495
25.4
15.8
ESP-ESP-3-1!
gpx
4:13:38
+39:05
37.0 32.0
1:37 1:52
15
Su.
10.
Sept
158.3
2475
2335
140
15.6
14.8
3-2-2
3:30:56
+21:22
45.0 40.9
1:20 1:28
Mo.
11.
Sept
Rest day
16
Tu.
12.
Sept
120.1
1965
1525
440
16.4
12.7
2!
2:38:23
+19:01
45.5 40.6
1:19 1:29
17
We.
13.
Sept
124.4
3220
1670
1550
25.9
13.4
1-1-ESP!
3:15:56
+26:56
38.1 33.5
1:35 1:47
18
Th.
14.
Sept
178.9
4630
4265
365
25.9
23.8
2-1-3-1-1!
gpx
4:47:37
+35:48
37.3 33.2
1:36 1:48
19
Fr.
15.
Sept
177.1
865
880
-15
4.9
5.0
3:42:09
+3:39
47.8 47.1
1:15 1:16
20
Sa.
16.
Sept
207.8
4405
4345
60
21.2
20.9
3-3-3-3-3-3-3-3-3-3
4:59:29
+31:52
41.6 37.6
1:26 1:36
21
Su.
17.
Sept
101.1
820
800
20
8.1
7.9
2:24:13
+13:30
42.1 38.5
1:26 1:34
Attention the GPS-files (gpx) are race stages and do not follow the traffic rules. The usage of the GPS-files (gpx) is on your own risk, any liability is excluded. The stages, GPS-files (gpx) were recorded with QMapShack using the information from the official organizer. The stages have been drawn most accurate as possible. Each stage starts at race km 0 and does not include neutralized kilometers. Trackpoints within tunnels were removed to eliminate incorrect vertical meters. We use the digital elevation model (copernicus.eu 1.0 DEM25) and a 5 point median filter to smooth deviation of the track points.
The radtoto.com profiles, GPS-files (gpx) and all data on the page 'stages' were created and published by radtoto.com. Copyright © by radtoto.com, all rights reserved. If you like to modify or publish files or data, ask for our approval.
Copyright © 2004 - 2023 radtoto.com. All rights reserved.
🤡🤡
Aktuell: Heute: Gestern: Gesamt: Seit:


 51940
51940
 44250
Δ 7690
44250
Δ 7690